
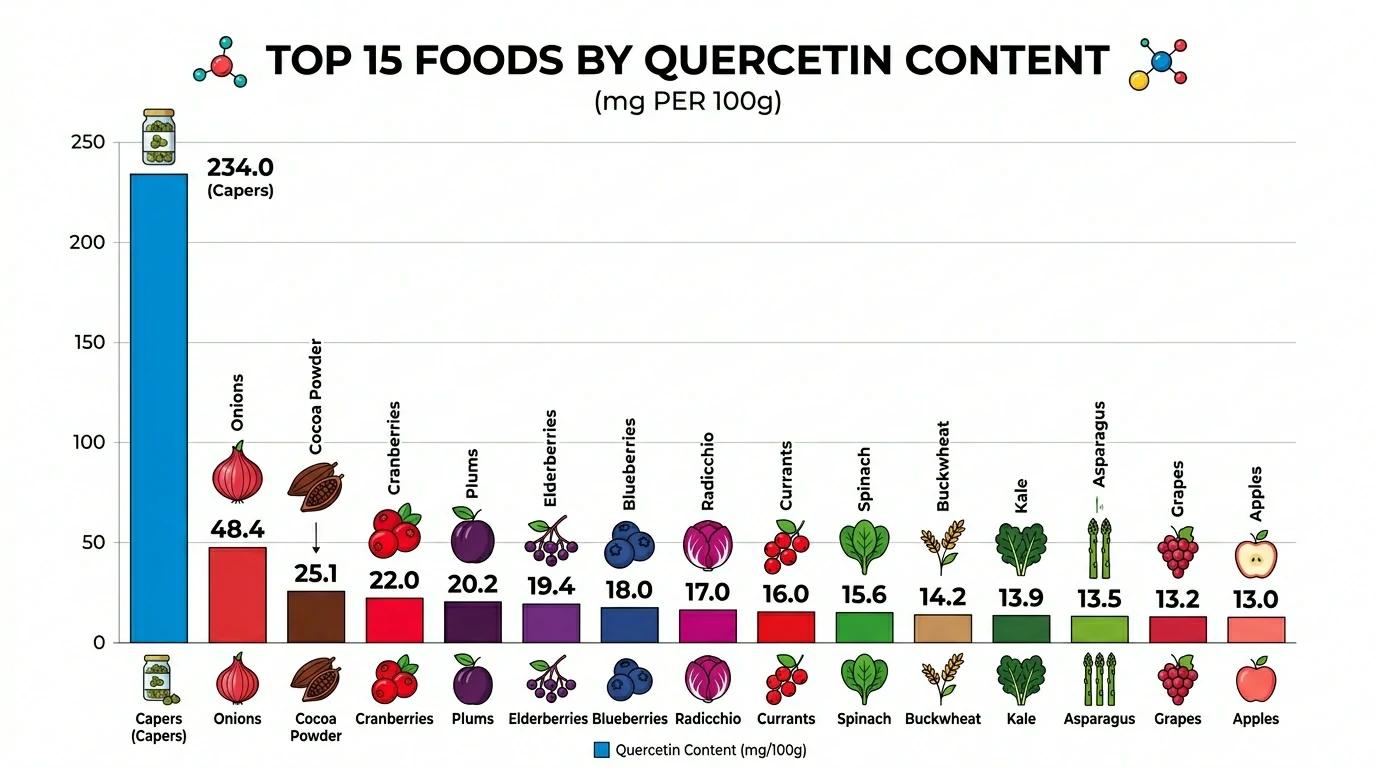
TL;DR — Quercetin is one of the most abundant flavonoids in the human diet, but its distribution across foods is extremely uneven. Capers sit at the top at 234 mg/100g — nearly 10× the next-highest common food. The practical window for dietary quercetin intake is 25–80 mg/day depending on eating patterns. Therapeutic doses of 500–1,000 mg used in clinical studies require supplementation: you'd need 1.5 kg of red onions daily to reach 500 mg. Cooking method matters — boiling leaches 25–33% of quercetin into water, while microwaving preserves 90–95%. Red onions, the most practical dietary source, concentrate quercetin in their outer rings; peeling those away removes up to 50%.
The Quercetin Food Paradox: Abundant in Nature, Scarce on the Plate
Quercetin is everywhere in the plant kingdom. It's a stress-response metabolite — plants produce it in response to UV radiation, pest pressure, and nutrient stress. This means that how a plant is grown matters as much as what plant it is.
The average Western diet provides 20–40 mg of quercetin per day (Hertog et al., 1993; The Lancet). Mediterranean and plant-forward eating patterns can reach 50–80 mg/day. But these numbers are dwarfed by the 500–1,000 mg/day used in clinical studies for allergy relief, immune support, and senolytic protocols.
The supplement gap: To reach 500 mg quercetin from food alone, you would need to eat approximately 1.5 kg of red onions — every single day. That's the fundamental reason why quercetin supplements exist. This article ranks foods by their quercetin content and explains what you can realistically achieve through diet.
Top 15 Quercetin-Rich Foods, Ranked by mg/100g
Data compiled from USDA Flavonoid Database (v3.3), Phenol-Explorer, and recent meta-analyses (Bhagwat et al., 2014; Rothwell et al., 2013).
Tier 1: Exceptional Sources (>100 mg/100g)
| Rank | Food | Quercetin (mg/100g) | Serving Size | Quercetin per Serving | Practical Notes |
|---|---|---|---|---|---|
| 1 | Capers (raw) | 234 | 10g (1 tbsp) | 23.4 mg | Highest natural source; consumed in small amounts as condiment |
| 2 | Capers (canned/jarred) | 173 | 10g | 17.3 mg | Brine processing reduces content by ~26% |
| 3 | Lovage leaves (fresh) | 170 | 10g | 17.0 mg | Herb; rarely consumed in quantity |
| 4 | Dill weed (fresh) | 79 | 5g | 4.0 mg | Herb garnish; not a meaningful quercetin contributor |
Tier 2: Strong Sources (20–60 mg/100g)
| Rank | Food | Quercetin (mg/100g) | Typical Serving | Per Serving | Key Context |
|---|---|---|---|---|---|
| 5 | Red onion (raw) | 32 | 80g (1 medium) | 25.6 mg | Most practical dietary source. Outer rings: 2–3× inner rings |
| 6 | Buckwheat groats | 27 | 100g (cooked) | 27.0 mg | Gluten-free grain; also contains rutin (a quercetin glycoside) |
| 7 | Cranberries (fresh) | 25 | 100g (1 cup) | 25.0 mg | Dried cranberries have lower content (processing loss) |
| 8 | Kale (raw) | 23 | 67g (1 cup) | 15.4 mg | Organic kale: 30–50% higher than conventional |
| 9 | Asparagus (raw, green) | 23 | 134g (1 cup) | 30.8 mg | Cooking reduces by 20–30%; spears retain more than cut pieces |
| 10 | Lingonberries | 21 | 100g | 21.0 mg | Nordic berry; difficult to source outside Scandinavia |
Tier 3: Moderate Sources (5–20 mg/100g)
| Rank | Food | Quercetin (mg/100g) | Typical Serving | Per Serving |
|---|---|---|---|---|
| 11 | Red delicious apples (with peel) | 13 | 182g (1 large) | 23.7 mg |
| 12 | Cherry tomatoes | 13 | 150g (1 cup) | 19.5 mg |
| 13 | Broccoli (raw) | 10 | 91g (1 cup) | 9.1 mg |
| 14 | Blueberries | 8 | 148g (1 cup) | 11.8 mg |
| 15 | Green tea (brewed) | 2–5 | 240ml (1 cup) | 2.4–6.0 mg per cup; 2–4 cups daily = 5–24 mg |
Honorable Mentions (5–10 mg/100g)
- Black grapes: 5–8 mg/100g (concentrated in skin)
- Red leaf lettuce: 8 mg/100g (outer leaves: 2× inner leaves)
- Yellow onion: 10 mg/100g (50–70% less than red)
- Red wine: 0.8–3 mg/100ml (modest contributor even at 1–2 glasses)
- Elderberries: 8 mg/100g (historically used in traditional medicine)
The Red Onion Breakdown: Why It's the Most Important Dietary Source
Red onions matter more than capers because people actually eat them in meaningful quantities. Understanding how quercetin distributes within an onion determines how much you actually get:
| Onion Layer | Quercetin Content (relative) | Notes |
|---|---|---|
| Outer dry skin | 200–300 mg/100g (dry weight) | Highest concentration — but inedible. Industrial extraction target. |
| Outer 2 fleshy rings | 45–60 mg/100g | The quercetin-rich zone. Peeling these away loses 30–50% of total content. |
| Middle rings | 20–30 mg/100g | Moderate decline from outer layers. |
| Inner core | 8–12 mg/100g | Lowest content. |
Red vs. yellow vs. white vs. sweet onions:
| Onion Type | Quercetin (mg/100g) | Flavonoid Profile |
|---|---|---|
| Red onion | 32 | High quercetin + anthocyanins (cyanidin) |
| Yellow onion (brown) | 10–15 | Moderate quercetin; higher kaempferol |
| White onion | 5–10 | Lowest quercetin; mild flavor |
| Sweet onion (Vidalia) | 3–8 | Lowest; bred for sugar, not flavonoid content |
| Shallot | 15–20 | Good quercetin source; also contains isorhamnetin |
Practical takeaway: Choose red onions. Peel minimally. The deeper red the onion, the higher the quercetin — the pigment is a proxy for flavonoid density.
How Cooking Affects Quercetin Content
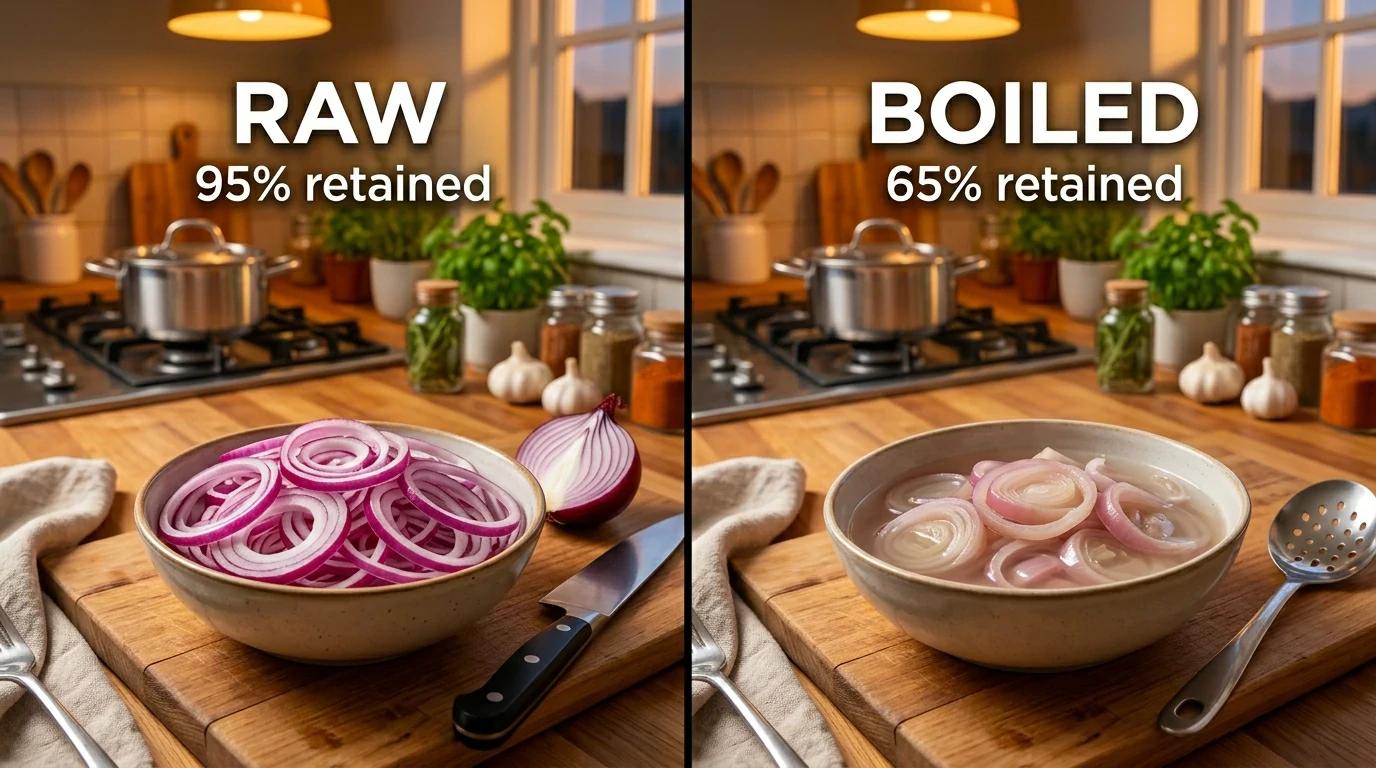
Quercetin is more heat-stable than most flavonoids, but cooking method matters significantly:
| Cooking Method | Quercetin Retention | Mechanism |
|---|---|---|
| Microwaving | 90–95% | Short heating time, no water contact → minimal leaching or thermal degradation |
| Sautéing / stir-frying | 80–90% | Oil medium protects from oxidative degradation; short cooking times |
| Steaming | 75–85% | Water vapor minimizes leaching; thermal degradation is main loss mechanism |
| Roasting / baking | 70–80% | Surface temperatures exceed quercetin degradation point (~200°C), but interior remains protected |
| Boiling (water) | 65–75% | Highest loss. Quercetin is water-soluble and leaches into cooking water. 25–33% lost in 10 minutes. |
| Frying (deep) | 60–75% | Variable; high temperature + oil medium creates competing degradation and protection effects |
What these numbers mean in practice:
- Sauté red onions for 5 minutes and you'll still get ~80% of the original quercetin — a net win if cooking makes you eat more of them.
- Boil broccoli and then discard the water, and you've thrown out 25–30% of its already-modest quercetin content.
- Apple peel contains 70% of the apple's quercetin. Peel it and you're left with ~4 mg per apple instead of 13 mg.
Two actionable rules for maximizing dietary quercetin:
- Cook with minimal water. Sauté, stir-fry, or microwave instead of boiling.
- Eat the peels and outer layers. Onion outer rings, apple skins, grape skins — that's where the quercetin concentrates.
Organic vs. Conventional: A Meaningful Difference
The organic-conventional flavonoid gap is one of the most replicated findings in agricultural science. A 2014 meta-analysis by Baranski et al. (British Journal of Nutrition, n=343 studies) found:
| Crop | Organic Quercetin Advantage | Mechanism |
|---|---|---|
| Onions (red/yellow) | +20–30% | Pest pressure upregulates phenylpropanoid pathway → more quercetin |
| Kale & leafy greens | +30–50% | No synthetic nitrogen → slower growth → more secondary metabolite accumulation |
| Apples | +20–40% | Fungal pressure without synthetic fungicides → flavonoid defense response |
| Tomatoes | +40–55% | Soil microbiome differences → systemic acquired resistance → higher flavonol production |
| Broccoli | +10–20% | Smaller effect; brassica flavonoid production less responsive to organic conditions |
The biological explanation is straightforward: quercetin is part of a plant's chemical defense system. When a plant faces mild stress (pests, UV, nutrient limitation) without synthetic pesticide protection, it upregulates flavonoid biosynthesis. Conventionally grown plants, shielded by pesticides and force-fed nitrogen, have less reason to invest resources in quercetin production.
For consumers: The organic premium for quercetin content is real and measurable, particularly in onions, kale, and tomatoes.
Dietary Quercetin Intake: Global Patterns
Quercetin intake varies dramatically by dietary pattern and geography:
| Population / Diet Pattern | Estimated Daily Quercetin (mg) | Primary Sources |
|---|---|---|
| Standard Western diet | 15–25 mg | Onions, apples, tea (moderate amounts of each) |
| Mediterranean diet | 40–60 mg | Red onions, capers, tomatoes, red wine, leafy greens |
| Japanese / East Asian | 30–50 mg | Buckwheat (soba), green tea, onions, kale |
| Vegetarian / plant-forward | 50–80 mg | Onions, kale, broccoli, apples, berries, tea |
| Vegan (whole-food) | 60–100 mg | Highest dietary intake; diverse plant food matrix |
Clinical dose comparison: Even the highest realistic dietary intake (100 mg/day) is only 10–20% of the 500–1,000 mg used in clinical studies. The jump from dietary to therapeutic levels requires supplementation.
Food-Supplement Synergy: Why Both Matter
Dietary quercetin and supplemental quercetin serve different purposes and are complementary:
| Dietary Quercetin | Supplemental Quercetin | |
|---|---|---|
| Typical daily dose | 25–80 mg | 250–1,000 mg |
| Primary benefit | Chronic, low-grade antioxidant protection; food matrix synergy | Targeted therapeutic effects (allergy relief, immune support, senolytic activity) |
| Absorption context | Glycosylated forms with food matrix → modestly improved absorption | Enhanced bioavailability forms (phytosome, EMIQ) compensate for isolated nature |
| Best use case | Daily health maintenance, E-E-A-T messaging, consumer education | Clinical protocols, therapeutic dosing, supplement product development |
For supplement brands, food content knowledge serves two roles: (1) credibility signaling — demonstrating deep ingredient knowledge to formulator and consumer audiences, and (2) dose justification — making it easy to understand why supplements are necessary when the math shows you'd need 1.5 kg of onions to reach clinical doses.
Learn more about high-purity quercetin from Sophora japonica — standardized to ≥95% HPLC purity for supplement formulation.
Research References
- Bhagwat S, Haytowitz DB, Holden JM. USDA Database for the Flavonoid Content of Selected Foods, Release 3.3. USDA Agricultural Research Service. 2014.
- Rothwell JA, Perez-Jimenez J, Neveu V, et al. Phenol-Explorer 3.0: a major update of the Phenol-Explorer database. Nucleic Acids Research. 2013;41(D1):D801-D807.
- Hertog MG, Hollman PC, Katan MB, Kromhout D. Intake of potentially anticarcinogenic flavonoids and their determinants in adults in the Netherlands. Nutrition and Cancer. 1993;20(1):21-29.
- Baranski M, Srednicka-Tober D, Volakakis N, et al. Higher antioxidant and lower cadmium concentrations and lower incidence of pesticide residues in organically grown crops. British Journal of Nutrition. 2014;112(5):794-811.
- Manach C, Scalbert A, Morand C, Remesy C, Jimenez L. Polyphenols: food sources and bioavailability. American Journal of Clinical Nutrition. 2004;79(5):727-747.
- Slimestad R, Fossen T, Vagen IM. Onions: a source of unique dietary flavonoids. Journal of Agricultural and Food Chemistry. 2007;55(25):10067-10080.
Related Articles
- From Sophora Japonica to Your Supplement: How Quercetin Extract Is Made — How food sources become supplement-grade extracts
- Free Radicals vs. Quercetin: The Antioxidant Mechanism Explained — The antioxidant mechanism behind dietary quercetin
- Quercetin and Inflammation: How This Flavonoid Inhibits NF-κB — Why food-sourced quercetin matters for chronic inflammation